
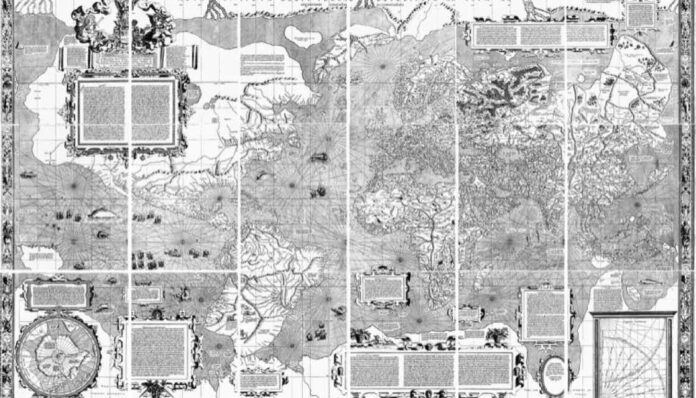
Look at the world map that hung in most classrooms and Greenland seems roughly as large as Africa. In reality Africa covers 11.7 million square miles and Greenland 836,330, which makes Africa about 14 times bigger.
That gap is not a printing mistake. It is built into the Mercator projection, a map drawn in 1569 that is still the most widely used view of the planet, and in September 2026 the United Nations voted to push countries toward something more honest.
The UN vote to correct the map
On September 4, 2026, the UN General Assembly backed a resolution called “Correct the Map.” It carries no legal force, but it encourages member states to use the Equal Earth projection, a map created in 2018, or any other map that shows landmasses at their true relative size.
The push came from Togo, in West Africa. Its foreign minister, Robert Dussey, told the assembly that maps shape how people imagine the world and that Africa should take charge of changing what it can.
The vote was lopsided. A total of 164 member states supported the resolution, six abstained, and the United States cast the only vote against it.
Why a 1569 map stretches the world
Flemish cartographer Gerardus Mercator designed his projection for sailors, and for that job it works beautifully. It preserves angles and direction, so a navigator who followed a single compass bearing could draw that course as a straight line on the chart.
To pull that off on a flat sheet, Mercator had to increase the scale the farther the map moves from the equator. Lands near the poles get stretched, while countries near the middle of the globe get squeezed.
Cartographer Tom Patterson, one of the people behind Equal Earth, has put it bluntly. Students who learn from a Mercator classroom map, he said, come away with a badly warped sense of how big countries really are.
Five size illusions the Mercator map creates
The distortion shows up all over the map. These are the biggest offenders:
- Africa and Greenland. They look similar in size, yet Africa is about 14 times larger. Africa also looks dwarfed by Russia, when it is actually about 1.77 times bigger than Russia’s roughly 6.6 million square miles.
- Antarctica. Some versions make it look larger than all of Eurasia and at least four times the size of Australia. It is about 5.5 million square miles, less than double Australia’s 2.9 million and less than half the size of Africa.
- South America and Europe. They appear close in size. South America covers around 6.9 million square miles against Europe’s 3.8 million, making it roughly 1.8 times larger.
- Alaska and Mexico. Alaska often looks at least three times the size of Mexico. Alaska measures 665,384 square miles, while Mexico is bigger at 761,610.
- The center of the world. Common versions place Europe near the middle and push the equator into the lower third of the rectangle.
The equator is not where you think
That last point is easy to overlook. The equator runs through central Africa and northern South America, splitting the Northern and Southern Hemispheres.
On the Equal Earth projection, the equator sits as a horizontal line across the middle of the map, and Europe moves up toward the top. Of course, a sphere has no true center at all, so any map that seems to put one region in the middle is making a choice.
Every flat map makes a trade
Mapmakers have tried plenty of alternatives over the years. Some maps flip the usual layout so that Antarctica sits at the top and Russia and Canada fall to the bottom, and others put the Pacific Ocean in the center with Africa on the left and the Americas on the right.
None of them is perfect, because no flat drawing can show a round planet without some distortion. James Cheshire, a cartography professor at University College London, has noted that Mercator did exactly what he set out to do, which was to make compass courses look straight.
The problem only starts when a navigation chart gets used as a picture of the world. For that job, the globe on so many desks has been the more accurate tool all along.
Based on reporting by Mental Floss
By Karen Whitfield | Geography